by Taylor Berge
Many owners and even breeders are confused when it comes to understanding exactly what PennHIP (the Pennsylvania Hip Improvement Program) is and how it’s used. One reason may be that there is no passing or failing score as there is with other methods for hip evaluation, such as OFA. It’s easy to understand what fair, good, and excellent mean. But what the heck does 0.38 mean? How can breeders use that information? How are owners or potential buyers supposed to understand it? This has also given way to several myths about PennHIP, such as the scores being relative to other dogs or that the “cut-off” score for washing a dog from a breeding program is purely a matter of opinion. Unfortunely, this also means that it has become the tool of choice for backyard breeders who do not use health testing to inform their breeding decisions appropriately, but merely to say they’ve “done it” while avoiding the consequences of receiving a “failing” grade. These breeders rarely use other methods like OFA to supplement the information provided by PennHIP. However, it’s very important that we recognize just how powerful this tool is when utilized appropriately. A better understanding will also help to prevent bad breeders from being able to circumvent health testing requirements by using it.
On this page I will explain how PennHIP works and how it differs from methods like OFA, and how we can best apply this method to improving hips in German Shepherd Dogs. I hope you find this page informative, I have spent countless hours researching and reading in order to provide the most up-to-date and accurate information possible. This includes emailing authors for papers behind paywalls, as well as reviewing the entire PennHIP manual. I did this because I truly believe in the power of this method and it’s ability to help stop canine hip dysplasia (CHD) from even being a consideration in the German Shepherd Dog.
I’d also like to make a disclaimer, I am not a veterinarian or medical professional. I have a degree in zoology and a scientific background, as well as detailed knowledge of the German Shepherd breed and their health issues. I review each paper critically and take note of the assumptions they make, the quality of their methods, sample size, representativeness and so on. This page includes information from these studies, the PennHIP website, the OFA website, and my opinions on the matter. I do not state anything as fact without a citation for it. This page is subject to change as new information comes out and my understanding of this method and the data behind it improves. I encourage all readers to do their own research. I’m very happy to discuss any of this further and provide citations if I’ve missed any.
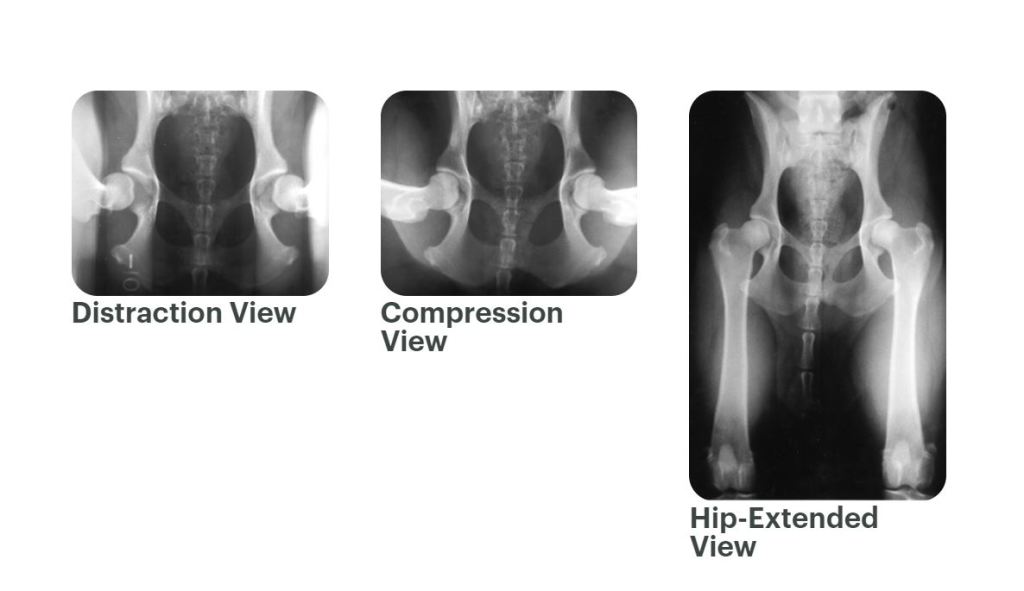
PennHIP can be used to diagnose CHD, but it’s true power lies in its ability to predict it. The method was developed in 1983 by Dr. Gail Smith, who had published several papers in support of his research. Perhaps the largest difference from most other methods is that it does not depend solely on the subjective assessment of the hip extended view radiograph (more on this below). It also makes use of two more- the compression and distraction views. These two radiographs are used to objectively determine the tightness of the hip joint, which is the most powerful predictor of CHD.
Dr. Gail’s research has shown several things that make the PennHIP method superior to others:
- Hip laxity (how loose the hip joint is) is a primary risk factor of a dog to develop CHD with the greater the laxity, the more likely they will develop it1,3.
- Laxity measurements are reliable from as young as 16 weeks2.
- Laxity is best measured using something called a distraction index from both a compression and distraction view radiograph1,3.
- Laxity is highly inheritable and the PennHIP method is the most effective tool for applying selection pressure in breeding to reduce the occurrence of CHD4,5.
How It Works
PennHIP works by measuring something called a distraction index (DI) that assigns a value between 0.0 and 1.0 to hip joint laxity, with the higher the value, the higher the laxity. This value becomes the dog’s score. It makes use of three radiographs- the distraction view, the compression view, and the hip-extended view. It’s has the ability to not only diagnose CHD in dogs, but to predict its onset. Each hip is assigned a number with the larger of the two becoming the dog’s official “score.” I want to be clear that the DI value is NOT relative to other dogs in the database. This is a common myth. Each score is obtained by analysis of each individual dog’s radiographs and is not based on the scores of other dogs. Learn more about how the distraction index is derived here. Hips with DIs that are less than 0.30 are considered to be at almost no risk of developing CHD, while DIs closer to 1 are considered to be extremely loose and highly likely to develop CHD. The DI value is relative to the looseness of the hip. For example, DI=0.58 means the femoral head comes out of the joint by 58%, DI=0.75 means the femoral head is 75% out of joint and so on.
Below is an example of a PennHIP report.
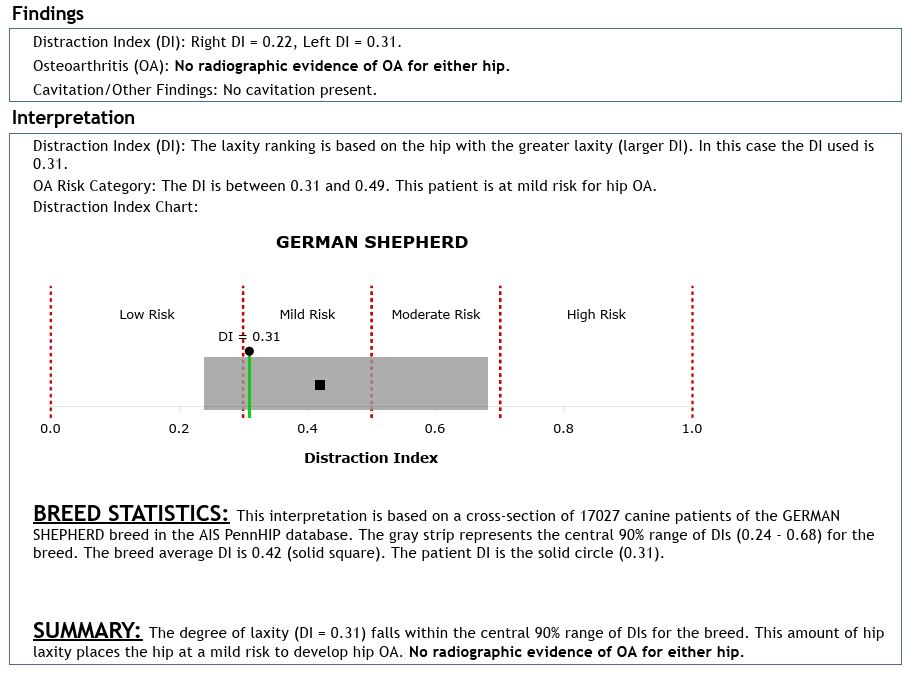
Under the Findings section, the DI for each hip is listed. The larger of the two is the dog’s official score. In the case of the report above, the dog’s score is 0.31, meaning the femoral head comes out of joint by 31%. The radiologist also assesses the extended view radiograph for signs of dysplasia and includes this in their findings.
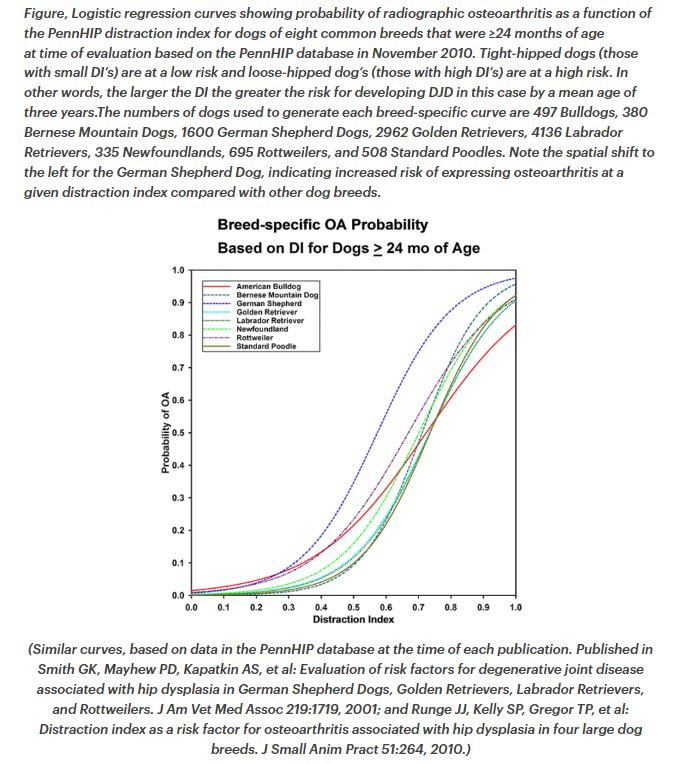
The Interpretation section of the report tells us which category the hip score falls into. It is most useful for letting us visually see where the hip score falls relative to the breed average DI score. We must be VERY careful in how we interpret the category meanings, particularly in the case of German Shepherds. This is where breed really matters and it’s important to have some background on the studies that were used to develop PennHIP. The risk categories are the same across breeds, and in my opinion this is weakness of the method. In an early study authored by Dr. Gale Smith, it was shown that the correlation between the DI value and risk of developing CHD is breed specific. In the study, which included 1600 German Shepherds, it was shown that they are 5 times more likely to develop hip dysplasia at an equivalent DI score compared to other breeds (see figure below)1. Other studies have also shown that German Shepherds are more susceptible to CHD6.
This means the categories of mild, moderate, and high are not particularly useful when choosing breeding stock. Even if the categories were to be accurate, they are probability based. Meaning any individual dog still has a chance of developing CHD at a given score. In other words, some dogs with low scores will develop CHD and some dogs with high scores won’t, and we don’t know which ones will or won’t. This is one reason I believe this method is best used in conjunction with others, like OFA or the SV’s. It’s so important breeders understand the category meanings and how they can or can’t be used. I greatly urge PennHIP users to not overemphasize the important of scores in the mild category, particularly those above the breed average. I’ll discuss this further below with some data that has been shared with me but is unfortunately not readily accessible to the public.
The Breed Statistics section is a bit more interesting. It is good to know how many dogs are in the database, as this influences the importance we put on the breed average value. In 2021, at the time of the example report above, there were over 17,000 GSDs in the database. This is a massive sample size and gives us great confidence in the representativeness of breed average value. The “central 90% range” statement can also be confusing to report readers. This does NOT mean your dog is in the 90th percentile! I am not sure why it’s even included to be honest. It simply means the reported score is within normal range for all the scores in the database. It does not mean it’s a good or a bad score, It’s typical. Previously, PennHIP included percentiles in the report until it was acquired by Antech in 2013 and I believe that is where some of this confusion comes from. I strongly think the percentiles for each breed should still be included in the reports, and I highly encourage others to attempt to contact Antech or your vet (who may have better luck contacting Antech) to push for this, as well as breed specific categories.
Now that we have a basic idea of what PennHIP looks like and how it works, lets talk about how to use this information in breeding decisions.
Using the PennHIP method in German Shepherds
Great care should be taken by a breeder to understand their breed’s specifics when it comes to PennHIP, as was discussed above. For instance, even though the “mild risk” category ranges from 0.30 to 0.49, in German shepherds, there is a huge difference in hip quality at each end of that spectrum. In the referenced figure, we can see that the probability curve for German Shepherds sharply increases as scores rise above the 0.30 mark. We also know that the average score for GSDs is currently (as of 2023) 0.41. This means scores above 0.41 are below average for the breed (worse hips). Further, Antech supplies its members with quarterly database updates as dogs are added to it. Unfortunately this information is not freely available to the public at this time, but it may be used by veterinarians who are members of Antech’s database. I cannot share it publicly due to Antech’s policies. However, I will show the snippet below that was given with me and if you’d like a citation, please send an email.


Here we see a sharp rise in scores between the 50th and 25th percentiles. That means a German Shepherd with a score of 0.48 or greater has worse hips than 75% of the GSDs in the PennHIP database, which includes over 18,000 dogs as of 2023. We can also see that even though the average score is 0.41 (the mean) the 50th percentile is 0.38. That means to breed in the top half of the population (the half with the best hip scores), you really want to be looking at dogs with a score of 0.38 or below.
PennHIP’s official recommendations can be found here under the “Selection Pressure in Breeding” section. Their policy is to breed with scores better than the average (the mean) or median (the 50th percentile) so again that would be 0.41 or 0.38 as of February 2023. While we can expect those numbers to change as more dogs are added to the database, we would not expect it to change a great deal as the sample size is now so large, and it is more likely to decrease if breeders continue to focus on breeding better hips in their programs.
PennHIP Vs. OFA, What you Need to Know
Now that we’ve gone in depth into understanding the PennHIP method, lets talk about how it differs from OFA. Almost every other method currently available use only the extended view radiograph to assess for signs of CHD and this is true for OFA too. Ratings are based on the expert opinions of three board certified veterinarian radiologists. They review the overall conformation of the hip. This includes how deeply the femoral head sits into the socket and how well formed the socket is. They make note of any irregularities and use them to inform their ratings. Failing ratings include Severe, Moderate, and Mild dysplasia. Passing ratings include Fair, Good, and Excellent. While PennHIP does provide assessment of dysplasia in their report, the DI score is an impartial, objective value based on laxity as opposed to the subjective (but expert) opinion of the OFA reviewers. I discuss the merits of OFA in my OFA article (coming soon!), and I highly suggest reading through that for a better understanding of how OFA itself works.
It is difficult to directly compare OFA and PennHIP because they do not assess the same things. However, we can compare their effectiveness in reducing the occurrence of CHD, as there are several studies on the topic. One study of 439 dogs found the following9:
- 14% of dogs OFA rated excellent by OFA standards and of those, 52% (31/60) had a DI scores at or above 0.30 (range, 0.14 to 0.61)
- 82% of dogs OFA rated good had a DI score at or above 0.30 (range, 0.10 to 0.77)
- 94% of dogs OFA rated fair had a DI at or above 0.30 (range, 0.14 to 0.77)
- All dogs with OFA rated borderline hip joints or mild, moderate, or severe hip dysplasia had a DI at or above 0.30 (range, 0.30 to 0.83).
Another study of 615 purpose-bred detection dogs assessed the effectiveness of applying selective pressure to improve hip joint quality by using PennHIP values along with OFA hip joint scores. They found that when OFA alone was used to select breeding stock, by using only dogs with ratings of good or excellent, hip quality remained unchanged. However, when they used PennHIP with the criteria being to only use DI scores at or below 0.30, along with an OFA rating of good or excellent, hip joint quality scores improved significantly7.
There are studies that show improvements in hips with use of OFA, and I discuss this in my OFA page (coming soon, but the PennHIP manual referenced at the beginning of this page also discusses this and has study citations). While it does appear OFA has made some difference, the owners ability to choose to not submit radiographs that they believe will fail causes a bias that underestimates the occurrence of poor hip quality, as those are less likely to be submitted. It is probable that the effectiveness of using OFA is lower than those studies show8. If you are a breeder, and you choose to hide failing scores by not initialing their release on the OFA form, you are not acting in the interest of the breed but for your own gain. OFA will become a much more powerful tool if they stop allowing breeders to hide failing scores.
One of the biggest benefits to OFA is the public database and ability to look up any dog who meets the criteria to be posted publicly. As of this time, PennHIP does not have a public database. However, if your dog has a profile with OFA already, you can add their PennHIP scores to the database. The OFA profile can be for any testing that is public, including hips, elbows, DM status, etc. All you need to do is a pay a small fee and send them the report. This has several benefits and negates the argument that PennHIP is not worthwhile because of the lack of database. It also ensures that breeders don’t lie about PennHIP scores. More information on how to add PennHIP scores to the OFA database can be found under the Submitting Non-OFA Health Screening Results section on their policy page.
Since PennHIP does not have a public database it’s extremely important to ask the breeder for the actual PennHIP report and then to verify that report with their vet and PennHIP. Tell the breeder you want to verify it with their vet and ask them to have the vet directly send you the report. I have personally seen forged reports, so it DOES happen and the only way to protect your investment is to independently verify the report through these means.
A few more differences between the two program are listed below
- OFA radiographs can be taken by any vet. Veterinarians who wish to perform PennHIP evaluations must be trained and certified by PennHIP to do so. This greatly increases the quality and repeatability of the evaluations.
- Dogs must be sedated for PennHIP to be performed. Under OFA this is optional, however I would highly encourage sedating regardless of the method chosen.
- Research has shown that PennHIP scores are accurate and reliable from as young as 16 weeks of age. I personally do them at 1-2 years old. OFA’s policy is that official certification cannot be done before two and that the older the dog, the more reliable the rating.
- Finding PennHIP vets can be harder, as they are less common and PennHIP is generally more expensive than OFA. If you’d like to find a PennHIP vet, you can search on the AIS website here.
Using PennHIP and OFA to inform your Breeding Decisions: It’s NOT a Matter of Opinion or Preference.
I want to reiterate and expound on some of what was said in the sections above. Because PennHIP scores are not “pass/fail”, less scrupulous breeders try to use it to bypass the consequences of a failing OFA score, or they just don’t understand the scores well enough to make the most informed decisions. However, PennHIP gives clear recommendations on what they think is suitable for breeding and what is not. I think this is why they do not give anything more than the average breed score in the report, even if I do not agree with that choice. If you truly care about improving hips and not just getting a pass/fail, using PennHIP and OFA (or another similar method, such as the SV’s or SUNCHO) together provides the best information to inform your choices. I discuss the logic of certain choices below.
Using a criteria of both OFA rated good or excellent AND PennHIP ratings below 0.30 have been shown to significantly decrease rates of CHD in subsequent generations. OFA alone, even with the criteria of only using good and excellent rated dogs, has not shown significant improvements. However, German Shepherds in the 75th percentile- meaning those with hips better than 75% of the population- are not below 0.30. The 75th percentile (as of February 2023) is 0.32. The 50th percentile is 0.38, the average is 0.41, and the 25th percentile is 0.48. The difference between the 75th, 50th, and 25th percentiles is significant. From a population genetics standpoint, it would be crazy to remove 75% of breeding prospects and choose only those with scores of 0.32 or better- doing so would most likely create a genetic loss catastrophe. Conversely, it seems much more logical to remove the worst 25% of the population (those with scores higher than 0.48). That alone would remove a significant amount of dogs most likely to pass on CHD susceptibility. With the information above, PennHIP’s recommendation to use the average (0.41) or Median (0.38) seems logical. Breeding anything above the average is likely to worsen hips in subsequent generations, so really this is a no brainer. Keep in mind the studies that show that German Shepherds are particularly susceptible to CHD when compared to other breeds, and when in doubt, don’t go with the more forgiving percentile.
Then, what about using OFA ratings in conjunction with PennHIP? Especially knowing that the two scores do not necessarily correlate, meaning it is totally possible to get a good PennHIP score and a bad OFA rating or vise versa. The research is pretty clear that PennHIP is a more reliable indication for the probability of a dog developing CHD and passing susceptibility onto their offspring. We also know that dysplastic dogs shouldn’t be bred, no matter how good their PennHIP scores are. Therefore, it is my opinion that the recommendations of both methods be followed. Do not breed dogs with OFA dysplasia ratings and do not breed dogs above the PennHIP breed average score. OFA tells us if a dog is dysplastic and how well the whole hip joint is formed. This is just as important as the laxity. Use the scores to choose your breeding pairs wisely within those bounds. If hips are a problem in your lines (assuming you know that because you’ve done the testing and reviewed the pedigree’s), then tighten the metrics.
I offer a lot of criticism of OFA, but I do believe OFA is a valuable tool. Especially for taking out the worst of the worst hips and finding the best of the best. Along with the study referenced above, I believe this counts to the validity of continuing to use OFA in conjunction with PennHIP. In German Shepherds, we likely do not have enough good hips to set the cut off at 0.30 but if we do make it the average (0.41) hips would start to dramatically improve in the breed. More breed specific research is needed from OFA and PennHIP to better decide exactly how these two methods can best be used together. I can’t say that we should only use dogs of good or excellent ratings, but I think that doing so would provide the greatest improvement in the breed. Perhaps if your dog is below the average score and receives and OFA fair, it would makes sense to breed them, but I think we should be much more strict about which dogs with OFA ratings of fair or worse and are above the average DI score should be used for breeding.
Of course this is just one person’s opinion and I’ll be the first to say that health testing is not a complete guarantee in either direction and is never the only (or even most important) consideration when looking at breeding prospects. A breeder who has clear goals in their program and produces consistent results, in health and otherwise, is going to occasionally break the rules. This will always be based on careful consideration and a thorough understanding of the merits of doing so. It’s best to not confuse this breeder with those who are simply trying to get a pass (or avoid the issue completely by using different methods and the ignorance of buyers) in order to breed.
- Smith GK , Popovitch CA, and Gregor TP. Evaluation of risk factors for degenerative joint disease associated with hip dysplasia in dogs, J Am Vet Med Assoc, 1995;206:642-647.
- Smith GK, Gregor TP, Rhodes WH, Biery DN. Coxofemoral joint laxity from distraction radiography and its contemporaneous and prospective correlation with laxity, subjective score, and evidence of degenerative joint disease from conventional hip-extended radiography in dogs. Am J Vet Res. 1993 Jul;54(7):1021-42. PMID: 8368595.
- Runge, JJ, Kelly, SP, Gregor, TP, et al.: Distraction index as a risk factor for osteoarthritis associated with hip dysplasia in four large dog breeds. J Small Anim Pract. 51, 2010, 264.
- Ginja, MMD, Silvestre, AM, Ferreira, AJA, et al.: Passive hip laxity in Estrela Mountain dog: distraction index, heritability and breeding values. Acta Vet Hung. 56, 2008, 303.
- Leighton, EA: Genetics of canine hip dysplasia. J Am Vet Med Assoc. 210, 1997, 1474.
- Popovitch CA, Smith GK, Gregor TP, Shofer FS. Comparison of susceptibility for hip dysplasia between Rottweilers and German shepherd dogs. J Am Vet Med Assoc. 1995 Mar 1;206(5):648-50. PMID: 7744685.
- Paster, ER, LaFond, E, Biery, DN, et al.: Estimates of prevalence of hip dysplasia in Golden Retrievers and Rottweilers and the influence of bias on published prevalence figures. J Am Vet Med Assoc. 226, 2005, 387
- Haney, P. S., Lazarowski, L., Wang, X., Wang, X., Hathcock, J., Lofton, R., Wilborn, R., & Waggoner, L. P. (2020). Effectiveness of PennHIP and Orthopedic Foundation for Animals measurements of hip joint quality for breeding selection to reduce hip dysplasia in a population of purpose-bred detection dogs, Journal of the American Veterinary Medical Association, 257(3), 299-304. Retrieved Apr 13, 2023, from https://doi.org/10.2460/javma.257.3.299
- Powers, M. Y., Karbe, G. T., Gregor, T. P., McKelvie, P., Culp, W. T. N., Fordyce, H. H., & Smith, G. K. (2010). Evaluation of the relationship between Orthopedic Foundation for Animals’ hip joint scores and PennHIP distraction index values in dogs, Journal of the American Veterinary Medical Association, 237(5), 532-541. Retrieved Apr 18, 2023, from https://doi.org/10.2460/javma.237.5.532
Supplemental reading:
I highly recommend checking all of the health related articles on Sirus Dog website, they have done an excellent job providing more of an in-depth summary of Dr. Gail’s research here, references included.
